Lumos Video Store
This page provides a list of educational videos related to Graphing. You can also use this page to find sample questions, apps, worksheets, lessons , infographics and presentations related to Graphing.
Polynomial Functoions and Their Graphs

By R Parsons
This is a video on polynomials and how to graph them. It also includes a discussion of various properties of their graphs.
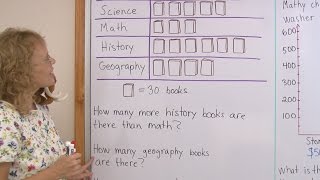
Graphs for 2nd grade - pictograph and bar graph
By mathmamoth
a pictograph (or a pictogram) and a bar graph. The pictograph has to do with books in a library, and one symbol of a 'book' means 30 books.
Graphs Of Square Root Functions
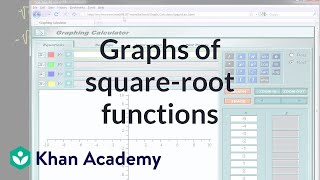
By Khan Academy
This Khan Academy video offers more information on graphing square root functions and contains a few sample problems with a step-by-step walkthrough on graphing these functions.
Graphing Using Graph Transformations - Example 2.

By PatrickJMT
A Video on Graphing Using Graph Transformations - Example 2. A complete example of graphing a function using graph transformations is shown.
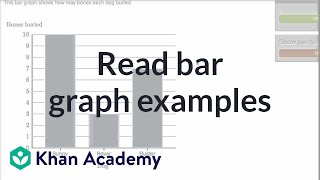
[2.MD.10-1.0] Picture and Bar Graphs - Common Core Standard

By Freckle education
Draw a picture graph and bar graph (with single-unit scale) to represent a data set with up to four categories.
Graphing Sine and Cosine with Transformations

By Mathispower4u
Graphing Sine and Cosine with Transformations
Building Scaled Picture Graphs: 3.MD.3

By TenMarks Amazon
Students learn the parts of a picture graph to build scaled picture graphs based on given data.
Line Graphs

By MathwithMrAlmeida
In this lesson Mr. Almeida describe why we use line graphs and how to read and interpret them. Is talks about how a graph shows change over time.
Interpreting graphs word problems
By Khan Academy
Sal considers the graph of a function that models temperature over time, and matches features of that graph to their real-world meaning.
Ex: Domain of Composite Function From Graphs

By Mathispower4u
Ex: Domain of Composite Function From Graphs
Graphs for Real, Complex, Quaternions, and Hypercomplex Numbers

By Doug Sweetser
Graphs for Real, Complex, Quaternions, and Hypercomplex Numbers
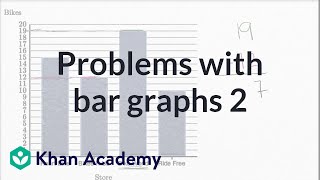
Bar Graphs- Pre Algebra Help
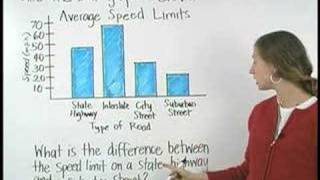
By yourteachermathhelp
Students learn that a bar graph is a visual way to display and compare numerical data (such as the population of different southern states). The bars of a bar graph are drawn in relation to a horizontal axis and a vertical axis and a bar graph can have either vertical or horizontal bars. Students are then asked to create bar graphs using given data and answer questions based on given bar graphs.
Velocity Time Graphs, Acceleration & Position Time Graphs - Physics

By The Organic Chemistry Tutor
This physics video tutorial provides a basic introduction into motion graphs such as position time graphs, velocity time graphs, and acceleration time graphs. It explains how to use area and slope to calculate the velocity, acceleration, displacement, and whether if the particle is speeding up or slowing down. It also explains how to determine if the velocity is increasing or if the acceleration is positive.
Graphing Transformations of the Cube Root Function
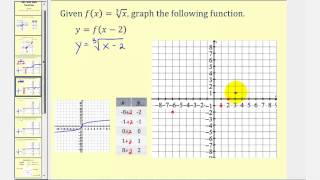
By Mathispower4u
Graphing Transformations of the Cube Root Function
More trig graphs

By Khan Academy
This video lecture series from Khan Academy on Trigonometry includes Radians and Degrees, Using Trigonometric Functions, The Unit Circle definition of trigonometric function, Graph of the Sine Function, graphs of Trigonometric Functions, Trigonometric Identities, Law of Cosines, Law of Sines, Polar Coordinates and Trigonometric Word Problems.
Charts Maps and Graphs: Finding Treasure - YouTube

By sedl
Charts Maps and Graphs: Finding Treasure - YouTube
Identifying proportional relationships with graphs

By Khan Academy
Learn how to tell proportional relationships by drawing graphs. Key idea: the graph of a proportional relationship is a straight line through the origin.