Lumos Video Store
This page provides a list of educational videos related to Distance and Absolute Value. You can also use this page to find sample questions, apps, worksheets, lessons , infographics and presentations related to Distance and Absolute Value.
Absolute Value | MathHelp.com
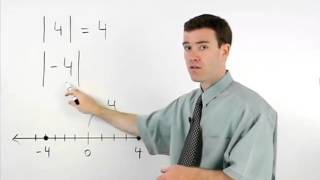
By MathHelp.com
This lesson covers histograms. Students learn that a histogram is a type of bar graph that shows the frequency of data in various intervals (such as the number of residents in a given neighborhood that are age 21-30, age 31-40, and so on). Note that the difference between a histogram and a bar graph is that in a histogram, the data is organized into intervals. Students are then asked to create histograms using given data, and answer questions based on given histograms.
Vertical Line Test | MathHelp.com

By MathHelp.com
This lesson covers absolute value. Students learn that the absolute value of a number is its distance from zero on a number line. For example, the absolute value of --8 is +8, because --8 is 8 units from zero on the number line. Note that the absolute value of any positive or negative integer is positive. Students also learn that the first step to simplifying absolute value problems is to simplify inside the absolute value, if possible.


[6.NS.8-2.0] Graphing Points in Coordinate Plane - Common Core Standard

By Freckle by Renaissance
Use coordinates and absolute value to find distances between points with the same first coordinate or the same second coordinate. Front Row is a free, adaptive, Common Core aligned math program for teachers and students in kindergarten through eighth grade. Front Row allows students to practice math at their own pace - learning advanced concepts when they're ready and receiving remediation when they struggle. Front Row provides teachers with access to a detailed data dashboard and weekly email reports that show which standards are causing students difficulty, what small groups can be formed for interventions, and how their students are progressing in math.

01 - The Distance Formula, Pythagorean Theorem & Midpoint Formula - Part 1 (Calculate Distance)
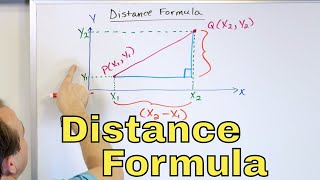
By Math and Science
Quality Math And Science Videos that feature step-by-step example problems!
Finding The Focus and Directrix of a Parabola - Conic Sections

By The Organic Chemistry Tutor
This video tutorial provides a basic introduction into parabolas and conic sections. It explains how to graph parabolas in standard form and how to graph parabolas with the focus and directrix. The vertex of the parabola can be identified by analyzing the equation in standard form.
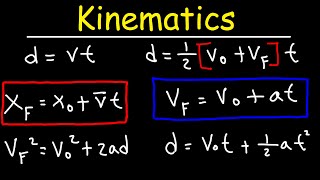
Velocity Time Graphs, Acceleration & Position Time Graphs - Physics

By The Organic Chemistry Tutor
This physics video tutorial provides a basic introduction into motion graphs such as position time graphs, velocity time graphs, and acceleration time graphs. It explains how to use area and slope to calculate the velocity, acceleration, displacement, and whether if the particle is speeding up or slowing down. It also explains how to determine if the velocity is increasing or if the acceleration is positive.


14 - Reference Angles Explained - Sine, Cosine & Unit Circle - Part 1

By Math and Science
Quality Math And Science Videos that feature step-by-step example problems!
How To Graph Trigonometric Functions

By The Organic Chemistry Tutor
This trigonometry video tutorial explains how to graph sine and cosine functions using transformations, horizontal shifts / phase shifts, vertical shifts, amplitude, and the period of the sinusoidal function. This video contains many examples and practice problems on graphing trigonometric functions for you to master this topic.

How To Graph Polar Equations
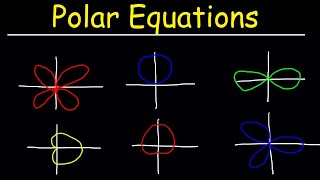
By The Organic Chemistry Tutor
The full version of this precalculus video tutorial focuses on graphing polar equations. It explains how to graph circles, limacons, cardiods, rose curves, and lemniscates. It provides plenty of examples and practice problems.