Lumos Video Store
This page provides a list of educational videos related to Line Graphs. You can also use this page to find sample questions, apps, worksheets, lessons , infographics and presentations related to Line Graphs.
Graphing Lines in Slope-Intercept form y=mx+b

By ProfRobBob
I introduce how to graph a line in slope intercept form. I also discuss graphing vertical and horizontal lines.
Line Graphs

By MathwithMrAlmeida
In this lesson Mr. Almeida describe why we use line graphs and how to read and interpret them. Is talks about how a graph shows change over time.

Inverse Functions | MathHelp.com
By MathHelp.com
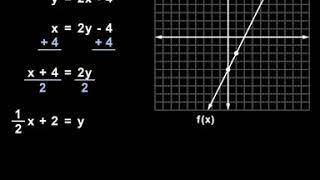
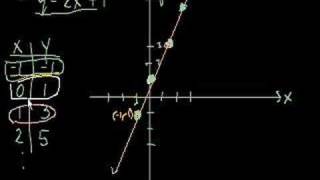
In this example, we’re given a relation in the form of a chart, and we’re asked to find the inverse of the relation, then graph the relation and its inverse. To find the inverse of a relation, we simply switch the x and y values in each point. In other words, the point (1, -4) becomes (-4, 1), the point (2, 0) becomes (0, 2), the point (3, 1) becomes (1, 3), and the point (6, -1) becomes (-1, 6). Next, we’re asked to graph the relation and its inverse, so let’s first graph the relation. Notice that the relation contains the points (1, -4,), (2, 0), (3, 1), and (6, -1). And the inverse of the relation contains the points (-4, 1), (0, 2), (1, 3), and (-1, 6). Finally, it’s important to understand the following relationship between the graph of a relation and its inverse. If we draw a diagonal line through the coordinate system, which is the line that has the equation y = x, notice that the relation and its inverse are mirror images of each other in this line. In other words, the inverse of a relation is the reflection of the original relation in the line y = x.
Graphing Lines on the Coordinate Plane
By Khan Academy
This video lecture series on Algebra from Khan Academy includes Linear Equations Solving Inequalities Slope and Y-intercept Equation of a Line Averages and Integer sums.
graphs and data line plot -"dot plots"

By Joann's School
Learn how to read and create a Line Plot (Dot Plot)

Vertical Line Test | MathHelp.com

By MathHelp.com
This lesson covers absolute value. Students learn that the absolute value of a number is its distance from zero on a number line. For example, the absolute value of --8 is +8, because --8 is 8 units from zero on the number line. Note that the absolute value of any positive or negative integer is positive. Students also learn that the first step to simplifying absolute value problems is to simplify inside the absolute value, if possible.

Fractions on a number line | Fractions | 3rd grade | Khan Academy
By Khan Academy
Graph and locate fractions on a number line.