Lumos Video Store
This page provides a list of educational videos related to Equations and Their Graphs- Getting Started. You can also use this page to find sample questions, apps, worksheets, lessons , infographics and presentations related to Equations and Their Graphs- Getting Started.
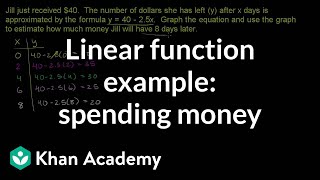
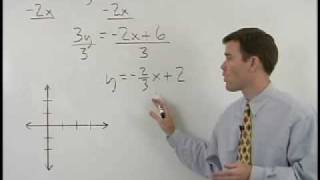
Khan Academy: Linear Equation Application Problem
By Khan Academy
Get more practice with functions by watching this word problem. Here you must graph the equation and use it to find a specific output. Start by creating a table to get a range of values. You'll need several ordered pairs to create the graph!

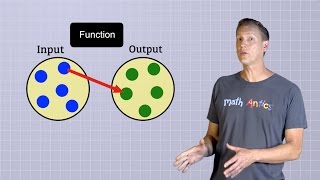
Inverse Functions | MathHelp.com
By MathHelp.com
In this example, we’re given a relation in the form of a chart, and we’re asked to find the inverse of the relation, then graph the relation and its inverse. To find the inverse of a relation, we simply switch the x and y values in each point. In other words, the point (1, -4) becomes (-4, 1), the point (2, 0) becomes (0, 2), the point (3, 1) becomes (1, 3), and the point (6, -1) becomes (-1, 6). Next, we’re asked to graph the relation and its inverse, so let’s first graph the relation. Notice that the relation contains the points (1, -4,), (2, 0), (3, 1), and (6, -1). And the inverse of the relation contains the points (-4, 1), (0, 2), (1, 3), and (-1, 6). Finally, it’s important to understand the following relationship between the graph of a relation and its inverse. If we draw a diagonal line through the coordinate system, which is the line that has the equation y = x, notice that the relation and its inverse are mirror images of each other in this line. In other words, the inverse of a relation is the reflection of the original relation in the line y = x.
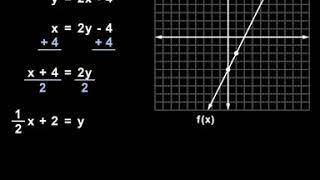
Systems of Three Equations | MathHelp.com

By MathHelp.com
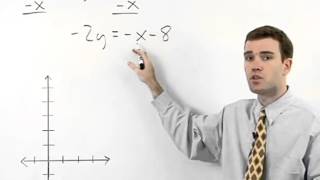
Here we’re asked to graph the following function and use the horizontal line test to determine if it has an inverse. And if so, find the inverse function and graph it. So let’s start by graphing the given function, f(x) = 2x – 4, and remember that f(x) is the same as y, so we can rewrite the function as y = 2x – 4. Now, we simply graph the line y = 2x – 4, which has a y-intercept of -4, and a slope of 2, or 2/1, so we go up 2 and over 1, plot a second point and graph our line, which we’ll call f(x). Next, we’re asked to use the horizontal line test to determine if the function has an inverse. Since there’s no way to draw a horizontal line that intersects more than one point on the function, the function does have an inverse. So we need to find the inverse and graph it. To find the inverse, we switch the x and the y in original function, y = 2x – 4, to get x = 2y – 4. Next, we solve for y, so we add 4 to both sides to get x + 4 = 2y, and divide both sides by 2 to get 1/2x + 2 = y. Next, let’s flip our equation so that y is on the left side, and we have y = 1/2x + 2. Finally, we replace y with the notation that we use for the inverse function of f, as shown here. And remember that we’re asked to graph the inverse as well, so we graph y = ½ x + 2. Our y-intercept is positive 2, and our slope is ½, so we go up one and over 2, plot a second point, graph the line, and label it as the inverse function of f. Notice that the graph of the inverse function is a reflection of the original function in the line y = x.

Finding The Focus and Directrix of a Parabola - Conic Sections

By The Organic Chemistry Tutor
This video tutorial provides a basic introduction into parabolas and conic sections. It explains how to graph parabolas in standard form and how to graph parabolas with the focus and directrix. The vertex of the parabola can be identified by analyzing the equation in standard form.
How To Graph Trigonometric Functions

By The Organic Chemistry Tutor
This trigonometry video tutorial explains how to graph sine and cosine functions using transformations, horizontal shifts / phase shifts, vertical shifts, amplitude, and the period of the sinusoidal function. This video contains many examples and practice problems on graphing trigonometric functions for you to master this topic.
Algebra Basics: What Is Algebra? - Math Antics

By Lumos Learning
This video gives an overview of Algebra and introduces the concepts of unknown values and variables. It also explains that multiplication is implicit in Algebra.

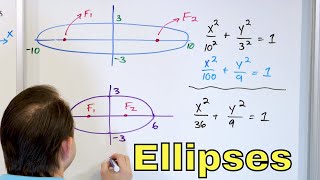
01 - Conic Sections: Ellipses - Graphing, Equation of an Ellipse, Focus - Part 1
By Math and Science
Quality Math And Science Videos that feature step-by-step example problems!
01 - Visualize Roots of Equations - Linear, Quadratic, Cubic, Quartic Solutions

By Math and Science
Quality Math And Science Videos that feature step-by-step example problems!
01 - Solving Equations in Quadratic Form - Part 1 (Learn to Solve Equations in Algebra)
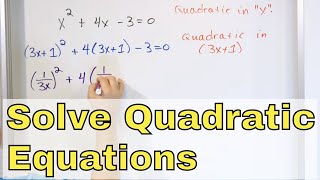
By Math and Science
Quality Math And Science Videos that feature step-by-step example problems!
ALL OF GRADE 9 MATH IN 60 MINUTES!!! (exam review part 2)

By Lumos Learning
Here is a great exam review video reviewing all of the main concepts you would have learned in the MPM1D grade 9 academic math course. The video is divided in to 3 parts. This is part 2: Linear Relations. In this video you will review everything there is to know about y=mx+b, scatterplots, and distance time graphs.