Lumos Video Store
This page provides a list of educational videos related to Displaying the Data. You can also use this page to find sample questions, apps, worksheets, lessons , infographics and presentations related to Displaying the Data.
Understanding Measurement Data Displayed in Line Plots: 2.MD.9

By Tenmarks Amazon
Students learn how to interpret measurement data displayed in line plots.
Comparing data displays

By Khan Academy
Sal solves practice problems where he thinks about which data displays would be helpful in which situations.
[4.MD.4-1.0] Fractional Line Plots - Common Core Standard
By Freckle education
Make a line plot to display a data set of measurements in fractions of a unit (1/2, 1/4, 1/8)
Calculating the mean from data displays
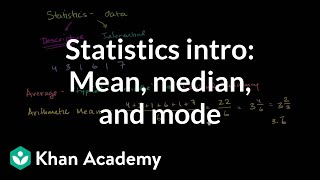
By Khan Academy
This is a fantastic intro to the basics of statistics. Our focus here is to help you understand the core concepts of arithmetic mean, median, and mode.
Creating a Scatter Plot

By TheMathClips
This video demonstrates how to take data from a chart (ordered pairs) and display it in a scatter plot.
Creating a Scatter Plot
By TheMathClips
This video demonstrates how to take data from a chart (ordered pairs) and display it in a scatter plot.
Practice 4 - Analyzing and Interpreting Data

By Bozeman Science
Science and Engineering Practice 3: Analyzing and Interpreting Data Paul Andersen explains how scientists analyze and interpret data. Data can be organized in a table and displayed using a graph. Students should learn how to present and evaluate data. Intro Music Atribution Title: I4dsong_loop_main.wav Artist: CosmicD Link to sound: http://www.freesound.org/people/CosmicD/sounds/72556/ Creative Commons Atribution License
Bar Graphs- Pre Algebra Help
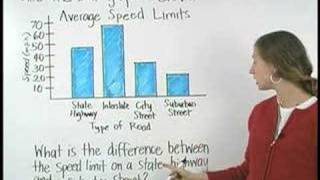
By yourteachermathhelp
Students learn that a bar graph is a visual way to display and compare numerical data (such as the population of different southern states). The bars of a bar graph are drawn in relation to a horizontal axis and a vertical axis and a bar graph can have either vertical or horizontal bars. Students are then asked to create bar graphs using given data and answer questions based on given bar graphs.
Line plots and stem-and-leaf plots
By MathPlanetVideos
Construct a stem-and-leaf plot out of the following data: 6, 6,7,8,9,13,16,19,21,25,26
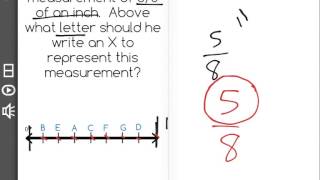
Interpreting Line plots
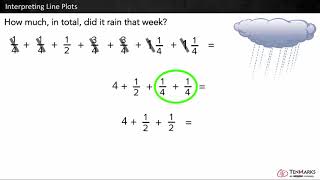
By Tenmarks Amazon
Students learn to interpret line plots by using the given data to answer questions involving fractions and whole numbers.
Line Plots for Fractions
By Icon Math
Make line plots to display measurements in fractions of a unit.
Introduction to line plots | Measurement and data | Early Math | Khan Academy
By KhanAcademy
Explanation about line plots
What is a Map? Crash Course Geography #2

By Math and Science
Quality Math And Science Videos that feature step-by-step example problems!

ICTS Big Questions: A Journey into the Quantum Universe with Subir Sachdev

By International Centre for Theoretical Sciences
The Life Autistic Documentary

By Lumos Learning
Iowans with autism illustrate the nuances of The Life Autistic in this two-hour broadcast special. We meet twelve people of different ages and backgrounds, along with their families and caregivers, to understand the daily lives and future prospects of people with autism. Their stories explore diagnosis, early intervention, family life, treatment, education, employment and independent living. Interviews with experts, educators and advocates -- including famed author and speaker Temple Grandin -- provide greater context and a better understanding of the many expressions of autism. Tyler Leech lends his unique perspective as a member of Iowa’s community of people with autism to the stories from the original Iowa PBS web series.
