Array
Lumos Video Store
This page provides a list of educational videos related to Displaying Data in a Line Graph. You can also use this page to find sample questions, apps, worksheets, lessons , infographics and presentations related to Displaying Data in a Line Graph.
[4.MD.4-1.0] Fractional Line Plots - Common Core Standard
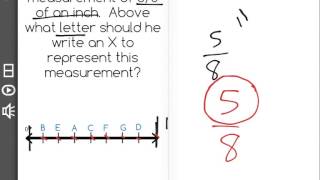
By Freckle education
Make a line plot to display a data set of measurements in fractions of a unit (1/2, 1/4, 1/8)
Line plots and stem-and-leaf plots
By MathPlanetVideos
Construct a stem-and-leaf plot out of the following data: 6, 6,7,8,9,13,16,19,21,25,26
Understanding Measurement Data Displayed in Line Plots: 2.MD.9

By Tenmarks Amazon
Students learn how to interpret measurement data displayed in line plots.
Interpreting Line plots
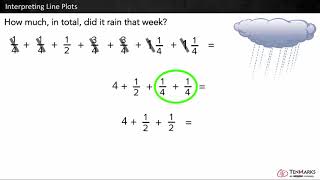
By Tenmarks Amazon
Students learn to interpret line plots by using the given data to answer questions involving fractions and whole numbers.
Line Plots for Fractions
By Icon Math
Make line plots to display measurements in fractions of a unit.
Introduction to line plots | Measurement and data | Early Math | Khan Academy
By KhanAcademy
Explanation about line plots