Lumos Video Store
This page provides a list of educational videos related to Analyzing Data. You can also use this page to find sample questions, apps, worksheets, lessons , infographics and presentations related to Analyzing Data.
Practice 4 - Analyzing and Interpreting Data

By Bozeman Science
Science and Engineering Practice 3: Analyzing and Interpreting Data Paul Andersen explains how scientists analyze and interpret data. Data can be organized in a table and displayed using a graph. Students should learn how to present and evaluate data. Intro Music Atribution Title: I4dsong_loop_main.wav Artist: CosmicD Link to sound: http://www.freesound.org/people/CosmicD/sounds/72556/ Creative Commons Atribution License
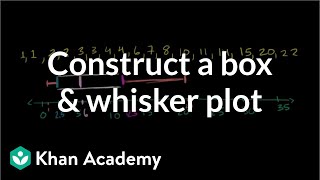
Reading box plots
By Khan Academy
Here's a word problem that's perfectly suited for a box and whiskers plot to help analyze data. Let's construct one together, shall we?
Creating box plots 2
By Khan Academy
Here's a word problem that's perfectly suited for a box and whiskers plot to help analyze data. Let's construct one together, shall we?
Creating box plots 1
By Khan Academy
Here's a word problem that's perfectly suited for a box and whiskers plot to help analyze data. Let's construct one together, shall we?
Understanding Data Distributions Using a Normal Distribution Curve

By PatrickJMT
The Normal Distribution and the 68-95-99.7 Rule. In this video, I talk about the normal distribution and what percentage of observed values fall within either 1, 2, or 3 standard deviations from the mean. One specific example is discussed. For more free math video, visit http://PatrickJMT.com
Algebra Applications: Exponential Functions

By Media4Math
In this episode of Algebra Applications, students explore earthquakes using exponential models. In particular, students analyze the earthquake that struck the Sichuan Province in China in 2008, months before the Beijing Olympics. This dramatic, real-world example allows students to apply their understanding of exponential functions and their inverses, along with data analysis and periodic function analysis. Segments include: What is an earthquake? The basic definition of an exponential function is shown in the intensity function for an earthquake. Students analyze data and perform an exponential regression based on data from the Sichuan earthquake. What is the difference between earthquake intensity and magnitude? An exponential model describes the intensity of an earthquake, while a logarithmic model describes the magnitude of an earthquake. In the process students learn about the inverse of an exponential function. How is earthquake magnitude measured? An earthquake is an example of a seismic wave. A wave can be modeled with a trigonometric function. Using the TI-Nspire, students link the amplitude to an exponential function to analyze the dramatic increase in intensity resulting from minor changes to magnitude. Go to www.media4math.com for additional resources.
Interpreting and comparing data distributions
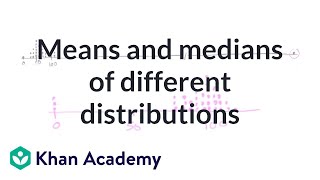
By Khan Academy
Interpreting and comparing data distributions
Interpreting and comparing data distributions
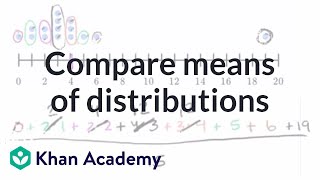
By Khan Academy
Interpreting and comparing data distributions
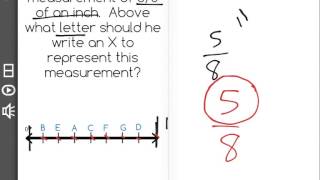
[4.MD.4-1.0] Fractional Line Plots - Common Core Standard
By Freckle education
Make a line plot to display a data set of measurements in fractions of a unit (1/2, 1/4, 1/8)
Line plots and stem-and-leaf plots
By MathPlanetVideos
Construct a stem-and-leaf plot out of the following data: 6, 6,7,8,9,13,16,19,21,25,26
graphs and data line plot -"dot plots"

By Joann's School
Learn how to read and create a Line Plot (Dot Plot)
Understanding Measurement Data Displayed in Line Plots: 2.MD.9

By Tenmarks Amazon
Students learn how to interpret measurement data displayed in line plots.
eSpark Learning: Analyzing Text Structure Instructional Video (6.RL.5)

By eSparkLearningVideos
This eSpark Learning instructional video aligns with Common Core State Standard 6.RL.5: Analyze how a particular sentence, chapter, scene, or stanza fits into the overall structure of a text and contributes to the development of the theme, setting, or plot.This instructional video is only one component of eSpark 's iPad-specific personalized learning systemâ€â€there 's more! We streamline the best third-party apps, great educational practices and data collection into one delightful K-8 platform used to add engagement and highly differentiated Common Core aligned content to a variety of classroom settings such as early learning, 1:1 programs, intervention, Special Education and more. Interested in learning more about eSpark? Visit our website: http://www.esparklearning.com
eSpark Learning: Theme, Setting, and Plot Framing Video (6.RL.5 Quest 4)

By eSparkLearningVideos
This eSpark video outlines a new learning quest that will help students master Common Core State Standard 6.RL.5: Analyze how sentences, chapters, and stanzas fit into the overall structure of a text and further develops the theme, setting, or plot.This framing video is only the beginning of eSpark Learning's iPad-specific personalized learning systemâ€â€'s more! We streamline the best third-party apps, great educational practices and data collection into one delightful K-8 platform used to add engagement and highly differentiated Common Core aligned content to a variety of classroom settings such as early learning, 1:1 programs, intervention, Special Education and more. Interested in learning more about eSpark? Visit our website: http://www.esparklearning.com
Introduction to line plots | Measurement and data | Early Math | Khan Academy
By KhanAcademy
Explanation about line plots
Interpreting Line plots
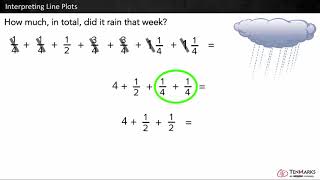
By Tenmarks Amazon
Students learn to interpret line plots by using the given data to answer questions involving fractions and whole numbers.
Line Plots for Fractions
By Icon Math
Make line plots to display measurements in fractions of a unit.
Statistics: Parallel Boxplots (Univariate Data)

By Educator
Watch more at http://www.educator.com/mathematics/statistics/yates/ Other subjects include Calculus, Biology, Chemistry, Physics, Algebra 1/2, Basic Math, Trigonometry, Pre-Calculus, Geometry, Pre-Algebra, Organic Chemistry, and Computer Science. -All lectures are broken down by individual topics -No more wasted time -Just search and jump directly to the answer
Evaluating Results (Business English)

By
In this video, we will discuss how to evaluate survey results. Remember that we do formal market research to answer the question: "Does the new product represent an opportunity in a market?"